Verdómetro
The Panamanian non-profit Centro de Incidencia Ambiental (Center for Environmental Advocacy) asked me to develop a tool to be used by their technicians to visualize and analize deforestation in Panama. Ciam uses litigation in Panamanian and international tribunals in search of environmental justice and needs data for everything they do. The tool is called Verdómetro (which could be translated as “Greenmeter”) and in the end they decided to make it available to the general public.
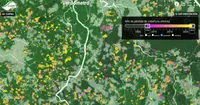
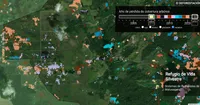
At the time I was developing the web map of natural corridors so I was able to use the same code base. I added the ability to view tree cover loss data from Global Forest Watch (Hansen) and the European Commission (TMF) so that they could be compared. Deforestation years can be displayed in different colors so that you can quickly visualize the year of tree cover loss.
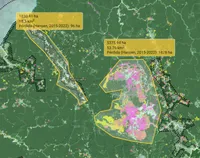
By drawing a polygon around an area of interest, the Verdómetro calculates the deforested area for the years that have been selected.
Like the dynamic corridor map, it is developed in OpenLayers and with serverless technology. The map is hosted on a normal web server using Protomaps. Deforestation calculations are done in the user’s browser, using GeoBlaze to analyze tree loss rasters, something that would normally require a desktop application or a server.
You can try the Verdómetro here.
- OpenLayers, Protomaps and GeoBlaze
- For: Centro de Incidencia Ambiental - Panamá
- Mir Rodríguez Lombardo, 2024


